
Breakevens that go bump in the night and other spooky things.
Sometimes there are announcements that send chills down Wall Street's collective spine. Other times, it's a well-defined trend portending disaster or threatening to upend the status quo that inspires fright.
With Halloween just around the corner, we asked some of Wall Street's brightest for the charts that are more terrifying than Freddy Krueger. This is what we got back.
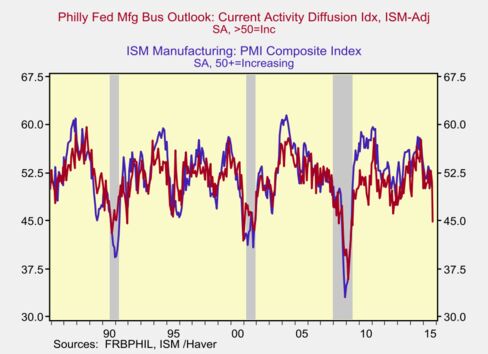
Deutsche Bank's chief U.S. economist, Joseph LaVorgna. "Take a chart of the ISM-adjusted Philly Fed survey and show it vs. the ISM. Tells us we're going into the mid-40s very soon on the latter. If that doesn't scare you, I'm not sure what will!"
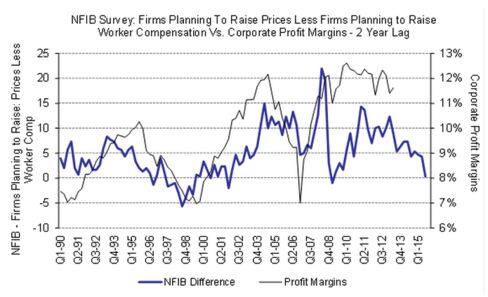
Citigroup chief market strategist Tobias Levkovich pointed to data from the NFIB survey of small businesses. "This is our lead margin indicator which suggests that margins will start to come down next year," he said. "This is not the end of the world, but people could be worried if they want—kind of like being scared of a jack 'o lantern but [for] no good reason."
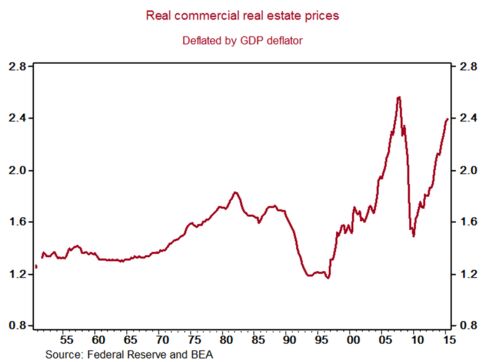
JPMorgan Chase chief U.S. economist Michael Feroli looked at soaring commercial real estate values, which have also been catching the attention of regulators recently. "It looks frothy," he noted.
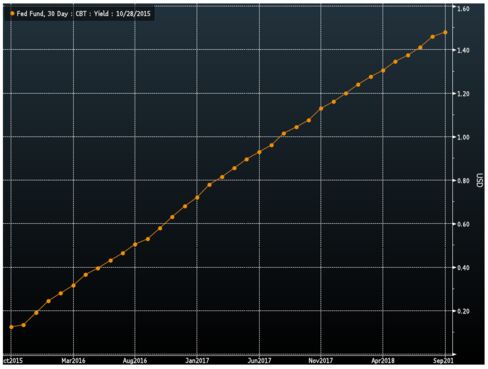
Renaissance Macro Research head of U.S. economics Neil Dutta said he's spooked by a market that seems unprepared for interest rate hikes in the face of inflation. "What scares me is that the market is barely priced for five rate hikes over the next several years," he said. "Unemployment will be below 5 percent and inflation above 2 percent. So the futures market strip scares me."
Renaissance Macro Research head of U.S. economics Neil Dutta said he's spooked by a market that seems unprepared for interest rate hikes in the face of inflation. "What scares me is that the market is barely priced for five rate hikes over the next several years," he said. "Unemployment will be below 5 percent and inflation above 2 percent. So the futures market strip scares me."
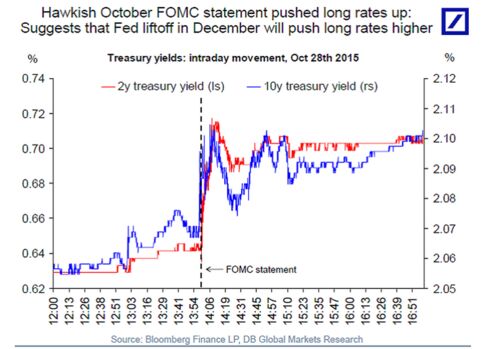
Deutsche Bank's chief international economist, Torsten Sløk, also underscored the degree to which investors may be caught off guard by a rate hike. "Since the October FOMC statement came out we have seen a solid move up in rates and the pain trade in markets at the moment is if rates continue to trend higher going into the December FOMC meeting," he said. "My sense is that not many investors are prepared for a rise in long-term interest rates."
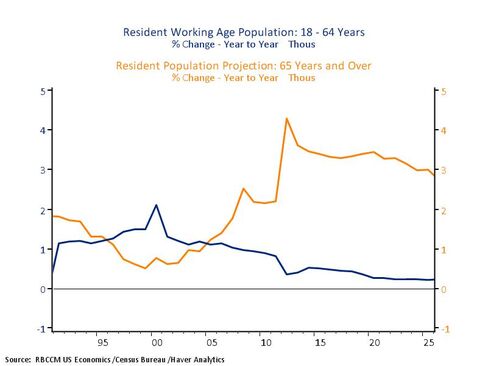
RBC Capital Markets senior U.S. economist Jacob Oubina is daunted by demographics: "My biggest concern is longer-run in nature: The reality that shifting demographics (the sharp divergence between strong growth in the retiring population vs. weakening growth in the working age population) will create both challenges for potential GDP growth (lower) and budget deficits (much higher)."
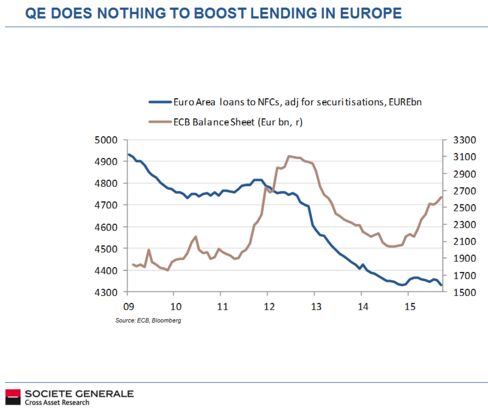
Société Générale global strategist Kit Juckes is worried that the European Central Bank's stimulus lacks the necessary efficacy to kick-start credit growth. "The ECB’s balance sheet is growing again, but it’s hard, perhaps impossible, to see any evidence that bond-buying (or super-low rates for that matter) and breathing any life back into private sector lending. The inability to revive lending severely hampers the Euro Area recovery and is a reason why growth continues at such a disappointing pace. There is little leeway for adverse shocks from, say, China. As for the ECB, its most effective policy tool is the Euro. If QE only works by boosting asset prices, it won’t do much for growth, but a weaker currency can help exporters. Only problem—Europe’s not alone in wanting a weaker currency these days."
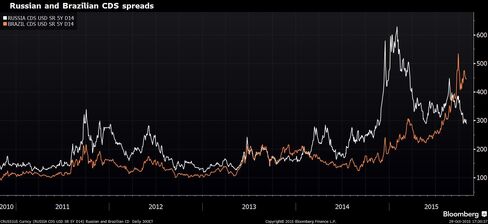
Fundstrat Global Advisors Managing Partner Thomas Lee highlighted sovereign credit default swap (CDS) spreads for Brazil and Russia as particularly spooky:
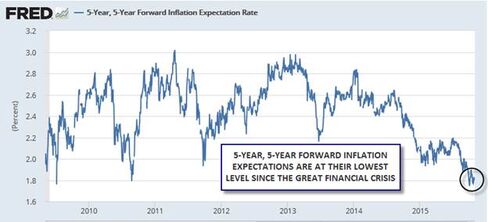
Forex.com senior market analyst Matt Weller thinks this chart keeps Janet Yellen & Co. up at night. "If I’m a Federal Reserve policymaker, the scariest chart I’m watching is the chart of five-year, five-year forward inflation expectations. In essence, this chart shows what the market expects the inflation rate to average over a five year period, starting in five years (i.e. the expected inflation rate from 2019 to 2024). In the most recent Fed minutes, the central bank noted that '… inflation was running below the Committee’s longer-run objective, but longer-term inflation expectations were stable.' If this measure of long-term inflation expectations continues to fall however, we could be in a low interest rate environment far longer than anyone expects."
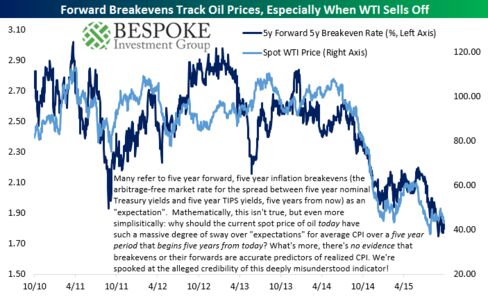
Bespoke Investment Group analyst George Pearkes, in contrast, said he's spooked by the way the market interprets inflation expectations and the "alleged credibility of this deeply misunderstood indicator."
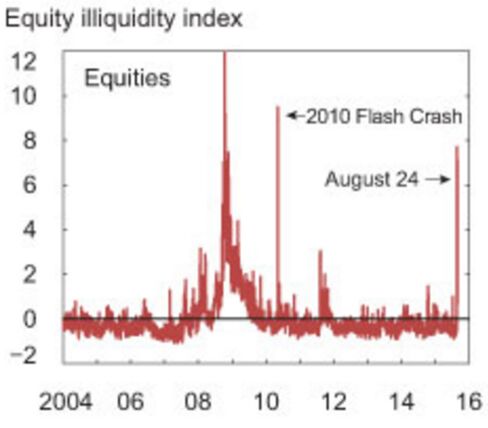
Credit Suisse Asset Management's head of fundamental strategies alternative fund solutions, Kelsey Deshler, highlighted an old markets chestnut. "While market liquidity has reverted back to pre-global financial crisis levels, liquidity risk has actually increased, resulting in wider bid-ask spreads and an inability to easily sell a position," she said. "In other words, liquidity is there but when you (and everyone else) need it, it may cost you. A scary thought indeed!"
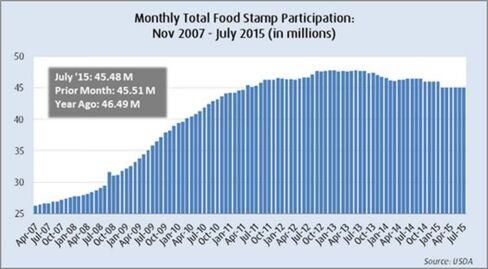
Convergex chief market strategist Nicholas Colas went with food stamp participation in the U.S. "Food stamp participation is still very high for what everyone is calling a ‘recovery.'" he said. "Contrary to some criticism, this is a reasonably well administered program, and the fact that participation remains so high this far into an economic expansion is another way of showing how uneven the recovery has been."
Watch Next: Evaluating the State of the U.S. Economy
Evaluating the State of the U.S. Economy
No comments:
Post a Comment